Sales Report
Sales reporting is a feature of retail billing software that provides retailers with insights into their sales performance and helps them make informed business decisions. This feature typically includes a range of reports that show sales data, such as revenue, sales volume, and profit margins. Some of the key benefits of sales reporting include:


- Improved business decision making: Sales reports provide a clear picture of sales performance, helping retailers make informed decisions about their business.
- Identifying trends: Sales reports can help retailers identify trends in sales, such as seasonal fluctuations or product popularity, which can inform their future business strategies.
- Increased transparency: Sales reports provide a clear, transparent view of sales performance, helping retailers identify areas of strength and weakness.
- Better inventory management: Retailers can use sales reports to monitor their inventory levels and determine which products are selling well, allowing them to make informed decisions about stocking and ordering.
- Better customer understanding: Sales reports can provide insights into customer behaviour, such as which products they are buying and when, which can help retailers provide better service and improve customer loyalty.
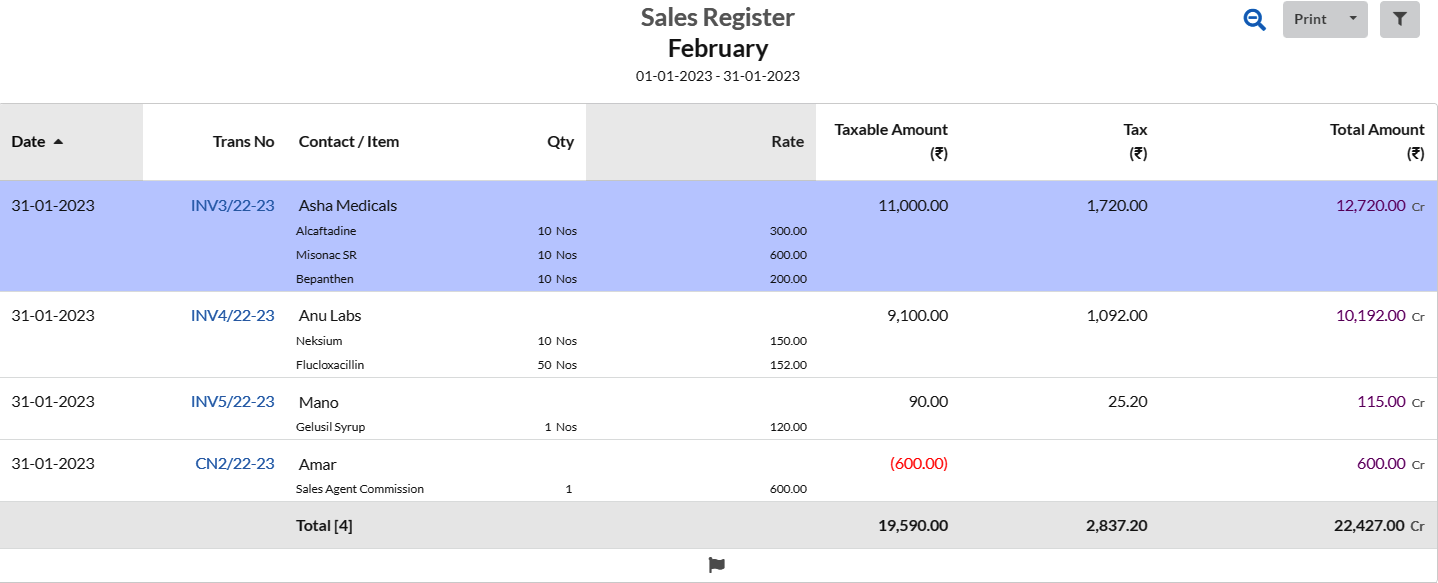
Sales data:
Sales data refers to the information related to sales transactions that a retail business has processed. This data can include details such as the date of the sale, the products sold, the customer information, and the amount of the transaction. Sales data can provide retailers with valuable insights into their business performance and can help them make informed decisions about their operations.Product performance:
Product performance refers to the sales performance of individual products within a retail business. It measures how well each product is selling and helps retailers understand which products are most popular, which are selling well, and which are not performing as expected. By monitoring product performance, retailers can gain valuable insights into their business and make informed decisions about their operations. Some of the key information that is included in product performance analysis is:- Sales volume: The total number of units sold for each product.
- Revenue: The total amount of money generated from sales of each product.
- Profit margins: The amount of profit generated from each product, expressed as a percentage of the product's sale price.
- Sales trends: The direction and rate of change in sales over time for each product.
- Best-selling products: The products that are generating the most revenue for the business.
Graphical representation:
Sales data can be represented in graphs, charts, and other visual formats, making it easier for retailers to understand and interpret the information. Graphical representation, also known as visual representation, is a method of displaying information, data, or concepts in a visual format. Some common types of graphical representation include:- Bar charts: used to compare the size of different data sets.
- Line charts: used to show trends over time.
- Pie charts: used to show the proportion of different parts of a whole.
- Scatter plots: used to show the relationship between two variables.
- Flow charts: used to show the flow of a process or the steps involved in a task.
- Maps: used to show geographic data or information about specific locations.
- Infographics: a combination of text, images, and charts used to present information in a concise and visually appealing manner.


Comments
Post a Comment